Service Quality Monitoring
Service Quality Monitoring
In this disruptive era, we are required to be able to make decisions quickly and correctly on the ground. This requires relevant and accurate data. In line with the direction of Telkom's Digital Business Director, “Fast is always good” and “No hearts feeling, look at data”, it means that we must always look at our service health data to make decisions regarding the services we have. The Devops Life Cycle also shows that monitoring is a phase that is passed before planning. It means that planning must be based on data in advance. This study discusses what data or metrics we have to monitor so we can clearly and accurately see the health conditions of services that are running in the field. From the results of the analysis in the Study, there are several Recommended Metrics based on the standards that used as references, namely:
- Processing Time (Response Time, Page Load & Render Time)
- Server Resources (CPU Usage, CPU Load, RAM, Storage, Bandwidth)
- Server Health (Uptime & Heartbeat)
- In-App Metrics (Success Rate, Error Rate, Application Specific Metrics)
- Network Performance (Delay, Jitter, Packet Loss)
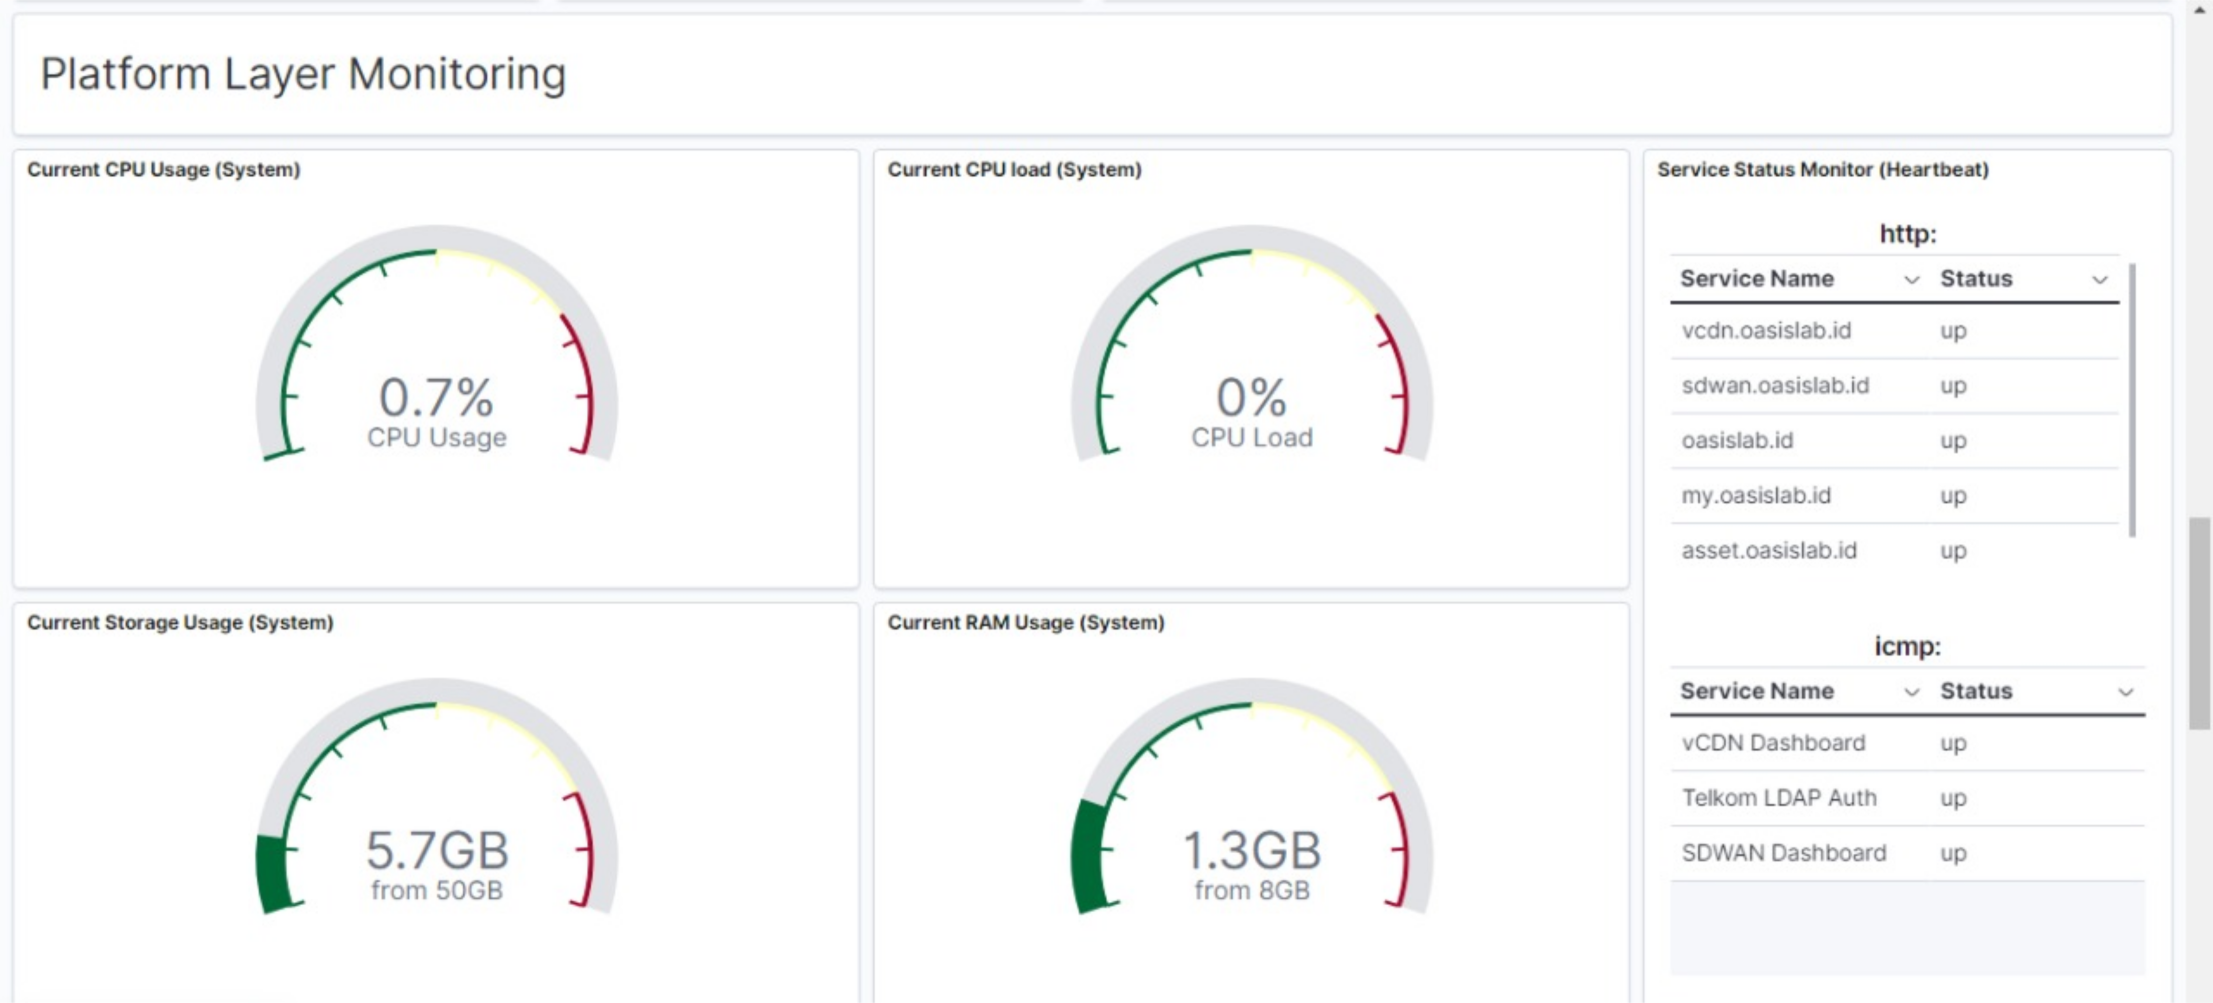
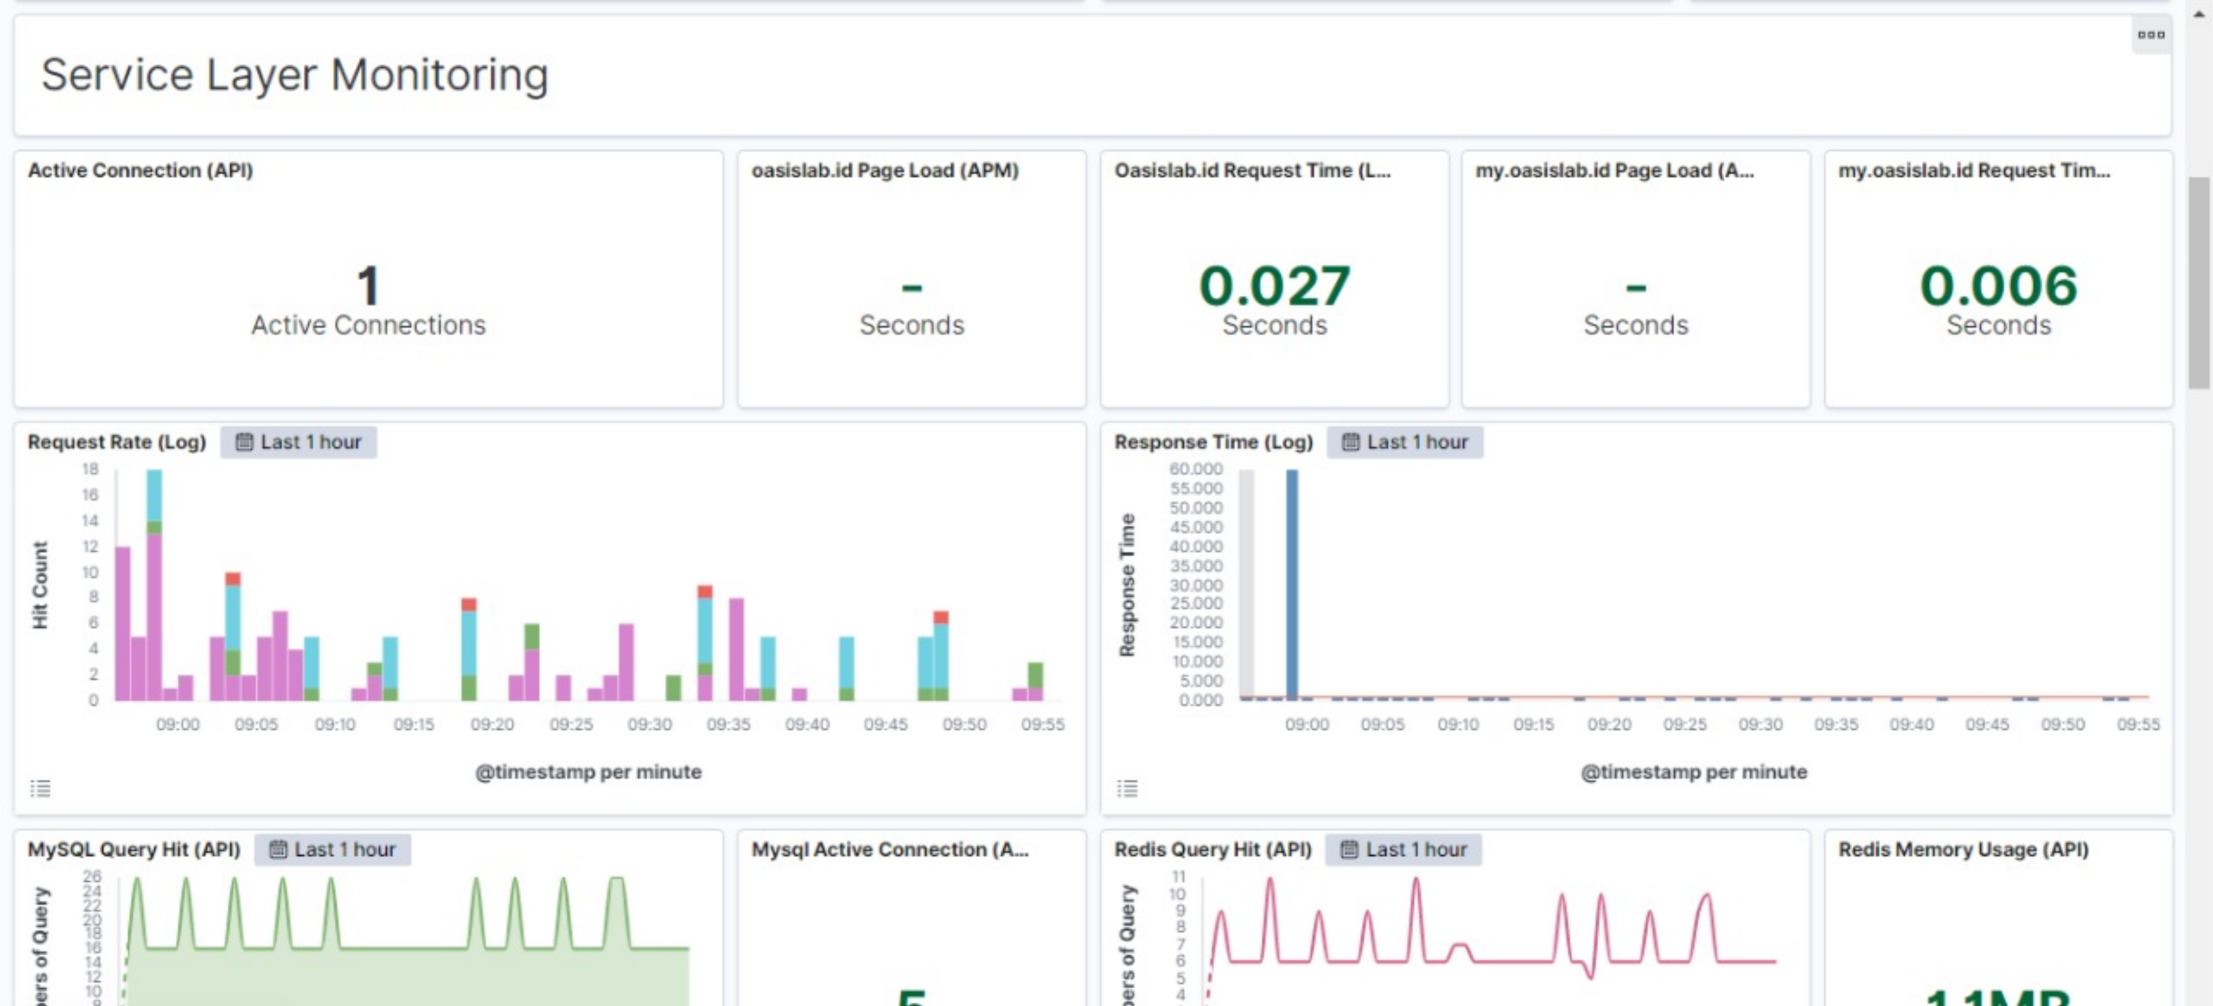
At this time, Service Quality Monitoring has been used to monitor the performance of oasislab in the form of a single page dashboard. The dashboard has been divided into several segments; the alerting segment, service segment, platform segment and network segment. To see our dashboard, you can click on the following button.